Trends are always fluctuating. What’s popular today may be old news tomorrow. It can be very difficult for brands trying to optimize their marketing strategies to get their products at the top of shoppers’ search results. According to Google, 84 percent of Americans shop in any given 48-hour period in up to six different categories. With so much time dedicated to shopping, consumers expect more and want it now. How can brands anticipate those demands? That’s where Google’s new version of Shopping Insights comes in handy.
Back in October, Google introduced a new and improved Shopping Insights tool that helps advertisers better identify popular brands and products, trends, and variations of these insights across US regions. With this updated tool, advertisers have access to data for more than 55,000 products, 45,000 brands, and nearly 5,000 categories. The revamped tool also includes some new key features to help inform advertisers so they can optimize their marketing strategies according to the latest trends.
Track the Popularity of Other Brands
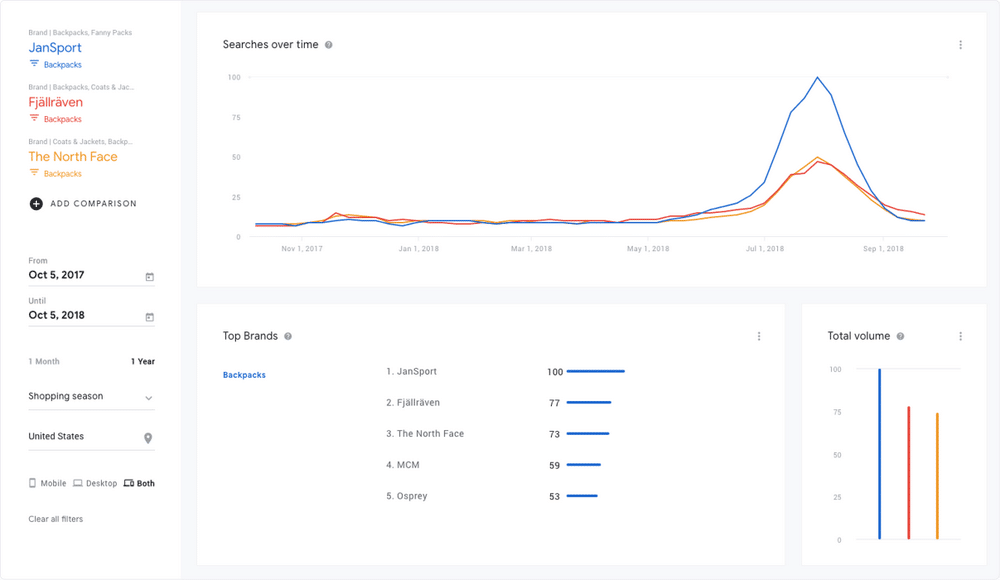
Knowing which brands are popular in a specific category can be very useful information when developing marketing strategies. According to Google, about nine out of 10 smartphone users do not know specifically from which brand to buy when they begin their online search. This fact is reassuring for brands that want to be discovered by new audiences. The new Shopping Insights allows advertisers to track the relative popularity of different brands in a specific category so they can adapt and optimize their marketing strategies.
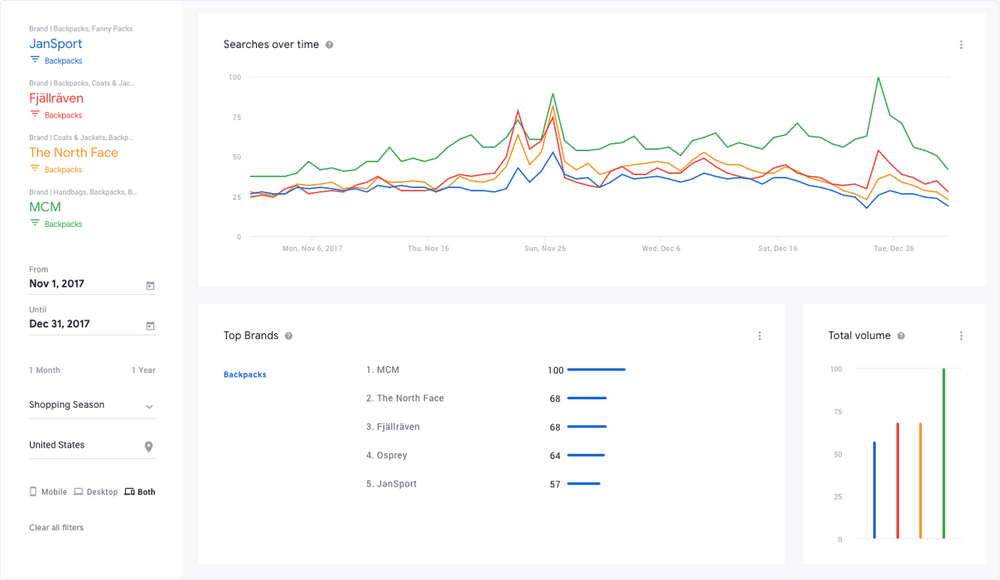
Google uses the example of backpack brands. The most-searched brands over the past year were JanSport, Fjällräven, and The North Face, with the most searches occurring in back-to-school season. In contrast, during the 2017 holiday season, the luxury brand MCM was the most-searched brand. Clearly, shopping behaviors and preferences change frequently, so having access to this data weekly makes it easier for advertisers to keep up.


Shopping Insights can also show data related to how many searches included specific brands and how many only included generic keywords related to a given category. Using the backpack example again, the top three brands during the 2017 holiday season were only mentioned in approximately 8 percent of the queries. In layman’s terms, shoppers primarily used keywords related to the category, such as “backpacks,” as opposed to entering a specific brand name into search.
With video game consoles, however, approximately 90 percent of the queries specifically mentioned the top three brands. That means shoppers knew the brand of the console they wanted when they began searching. Both scenarios require different approaches for improving a brand’s appearance in search results.
Receive Personalized Trend Reports
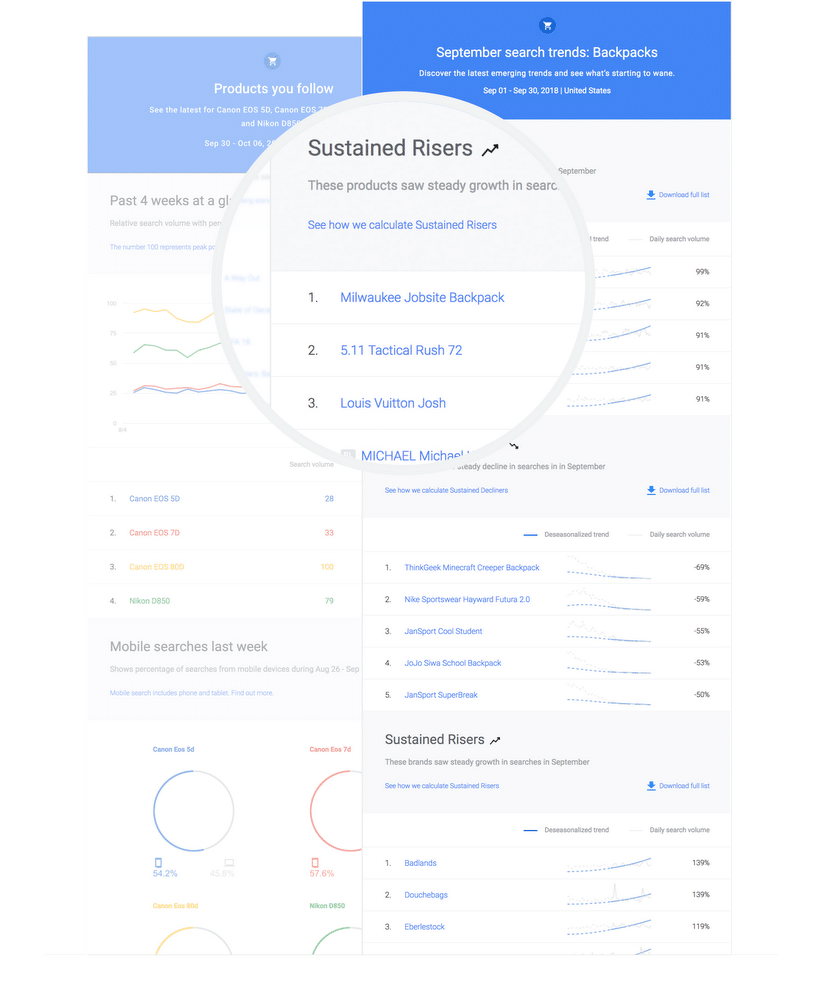
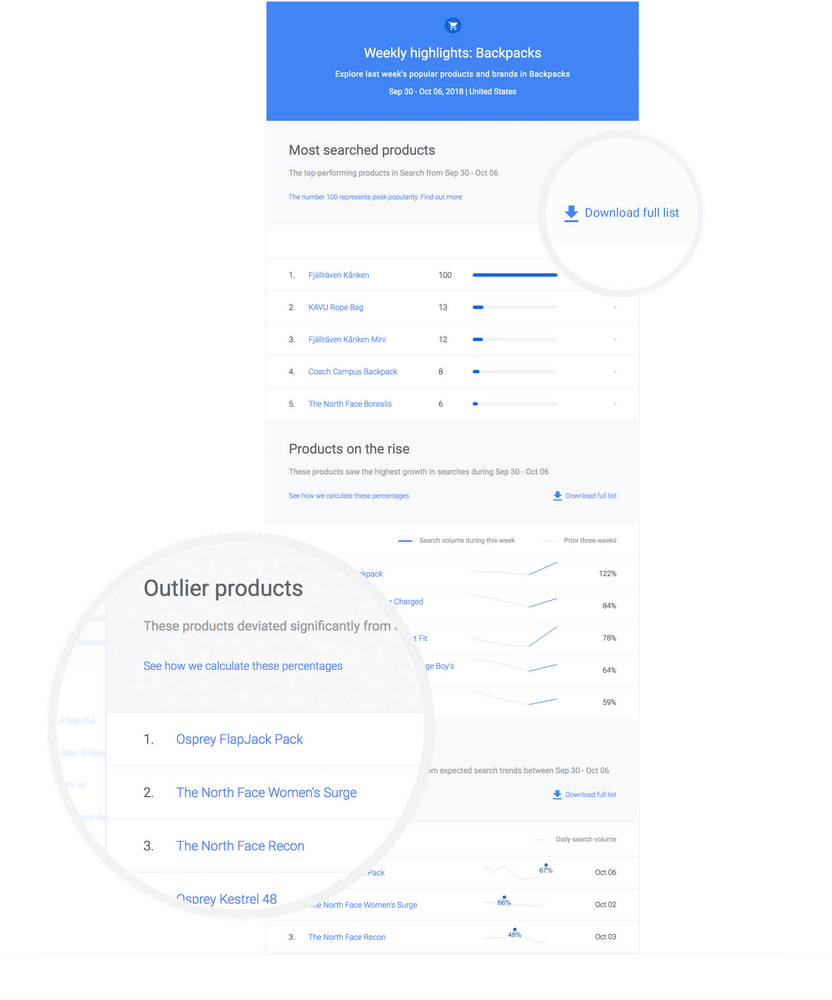
Shopping Insights now allows advertisers to subscribe to receive up to 10 weekly and monthly email reports. This makes it easier to monitor the trends of specific products and categories. Google says it will share additional data on popular, growing, and trending products and brands. Monthly reports extract any seasonal or other effects from search volume to show what is truly trending up or down. Weekly reports show which products saw the most growth in the past week. Both report types provide valuable information to aid marketing strategies.


New tools keep emerging to help advertisers optimize their strategies. Back in September, Google introduced its Ad Strength tool, which measures an ad’s effectiveness prior to publication.
Anybody Can Use It
Shopping Insights is free and available to anyone in the U.S. on both desktop and mobile. It can only get better from here. Staying trend-savvy has never been so easy. Besides, being out of the loop is so passé.
