Facebook is an incredibly powerful platform for brands and advertisers, allowing you to track all sorts of metrics – so many metrics, in fact, that it can get overwhelming. All of that data is useless if you don’t know what you need to pay attention to and how to decipher what you’re seeing.
In this article, we’re going to cover the most important Facebook metrics to watch, including those for video and ad content.
What Are Facebook KPIs?
Facebook’s KPIs – which stands for “key performance indicators” – measure the performance of the content you post, whether that’s an organic post or a Facebook Ad. Essentially, KPIs tell you how well your content is performing, and they can also clue you into where you need to make improvements. Furthermore, every time a user sees or interacts with the content you post, Facebook gathers data about it, which can help you narrow down your target audience.
FYI, KPIs and metrics are two terms that are often used interchangeably, but they actually have specific differences. For our purposes, we’re referring to KPIs and metrics by the definition outlined above. If you want to explore more about each term, check out this article.
The Most Important Facebook Metrics for 2023
The most important Facebook Ad metrics to track depend on your specific business and goals. However, we’re going to cover the main ones we think you should consider.
- Engagement: The number of times users take action on something you post, like leaving a comment or sharing the post. (Engagement is important because it means that people like what you post. Also, Facebook favors popular posts, so the more engagement yours gets, the more Facebook will show it.)
- Impressions: The number of times a post was seen, even if it was viewed multiple times by the same person. (The more times a person sees the same post, the more likely it is that they’ll take action; impressions also show you how viral your post has become.)
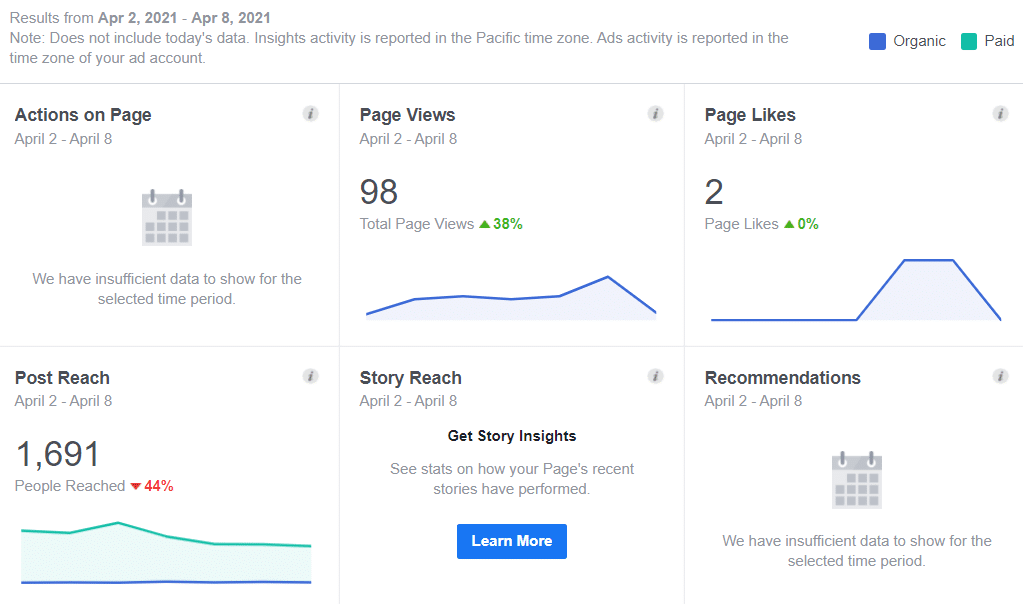
- Page Likes: The number of people who “like” your page and want to see your content in their feed. (While thought of as a vanity metric by some, you should see your page likes growing with time – this is an indication that your audience is growing, too.)
- Reach: How many people see your Facebook content, whether that’s organic or paid.
- Referral Traffic: How many visitors your website gets from Facebook. For example, if a user clicks a link in your profile or post, that data is included in the referral traffic metric.
- Audience Share: Audience Share is a metric that measures the percentage of your target audience that sees your ad. It is calculated by dividing the number of people who saw your ad by the total number of people in your target audience.
- Sentiment: The sentiment metric gauges the emotional tone of social media conversations surrounding your brand. It’s determined by analyzing the language used in these conversations, searching for positive, negative, or neutral words and phrases.
Most of this data can be found in your Facebook insights, and there are also third-party tools that you can use to track and analyze this information. For example, you’ll need something like Google Analytics to measure referral traffic.
Video Metrics to Pay Attention To
If videos are part of your Facebook marketing strategy, you’ll want to keep a close eye on these two metrics:
- Video Engagement: This engagement metric is similar to the one defined above, but on top of actions like comments, likes and shares, you’ll also see how many times your video was clicked to play (not auto-played).
- Video Retention: How much of your video users are watching. If you’re spending time creating a 5-minute video but users are only staying tuned in for 45 seconds, you either have to cut the length down or create a more compelling video.
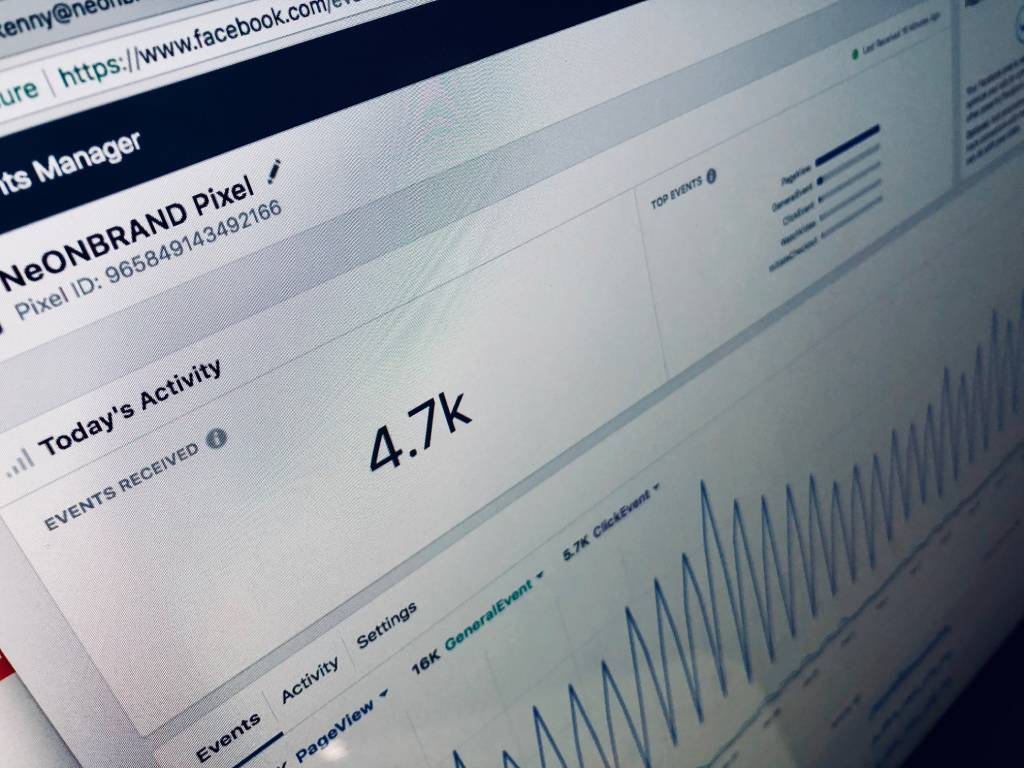
Unsplash / NeonBrand
Facebook Ad Metrics to Pay Attention To
Facebook Ad metrics are in a category of their own, and there’s a lot of data to work with here. To start, give these metrics more than a passing glance:
- Ad Frequency: How many times people see one of your ads. This one is tricky – you want people to see your ads more than once for them to be as effective as possible, but too much exposure can lead to ad fatigue. A good rule of thumb is that users should see your ad up to two times per week, but not more frequently. This is also a good case for A/B testing because users will be exposed to the same information without seeing the exact same ad over and over.
- Click-Through Rate (CTR): The percentage of people who view your ad and then click (through) to your landing page. If the CTR is too low (like under .9%, the industry average), it means that people don’t feel compelled to take action when they view your ad.
- Cost per Action (CPA): With CPA, you can find out how much you pay per action, like when a user downloads your app or subscribes to your email list. WordStream reports that the average CPA is $18.68, so your data should be around that number.
- Cost per Thousand Impressions (CPM) / Cost per Click (CPC): With CPM, you’re charged per thousand impressions; with CPC, you’re charged whenever someone clicks an ad. CPC is the more common option of the two, and according to WordStream, the average is $1.72 – so if you’re paying much more than that, your ad isn’t optimized enough.
“Cost per…” metrics refer to how you’re charged for Facebook Ads, and they can be more important than how much you spend on ads overall because they tell you how efficiently you’re spending.
P.S. We have a bunch of articles about Facebook Ads and metrics, like this one about Facebook Ad retargeting for e-commerce and this one that covers the difference between reach and impressions more thoroughly.
Wrapping Up
Before you plan out the next phase of your digital strategy, consider the data you collected from Facebook metrics. Also, limit how many metrics you focus on at one time. Pick two or three that matter the most to you and dig deep into them. When you feel you’ve optimized your content as much as possible, move on to another. Data is going to be continually collected, so you can always tap into other metrics sometime in the future.
FAQs
What are the most essential Facebook metrics?
The Facebook metrics that are most important will differ based on your business objectives. Nonetheless, some key metrics to consider are:
- Reach: This measures the number of individuals who have seen your advertisement.
- Impressions: This gauges how many times your ad has been displayed.
- Click-through rate (CTR): it’s the percentage of individuals who have clicked on your ad after viewing it.
- Conversion rate: Indicates the percentage of people who have taken a desired action after seeing your ad, such as purchasing a product or enrolling in your mailing list.
- Cost per acquisition (CPA): This represents the money you have spent to acquire a new customer.
How do I track Facebook metrics?
To monitor your Facebook metrics, you can utilize Facebook Ads Manager. This tool enables you to design and oversee your Facebook advertisements while monitoring their effectiveness.
What is the difference between reach and impressions?
The term “reach” refers to the number of individuals who viewed your advertisement, while “impressions” reflects the number of times your ad was displayed. Therefore, reach is a metric that gauges the number of distinct individuals who saw your ad, whereas impressions are a measure of how often your ad was shown, regardless of whether it was viewed by the same person more than once.
How can I improve my Facebook metrics?
There are a number of things you can do to improve your Facebook metrics, such as:
- Target your ads more effectively.
- Use relevant and engaging ad copy.
- Use strong visuals.
- Run A/B tests.
- Track your results and make adjustments.
What are some common mistakes people make when tracking Facebook metrics?
Some common mistakes people make when tracking Facebook metrics include:
- Not tracking the right metrics: Not all metrics are created equal. It’s important to track the metrics that are most important to your business goals.
- Not tracking their results over time: It’s essential to track your results over time so you can enhance the campaign’s effectiveness.
- Not making adjustments to their campaigns: If you do not see the results you want, don’t be afraid to make adjustments to your campaigns.