The various ways users engage with their mobile devices reveal valuable information about the best way to market to them. Marketing data and research analyst Emarketer shared its US estimates on mobile behaviors to help marketers get the most out of their mobile strategies in 2018. Facebook, too, has its own data on mobile usage, focusing on usage of its products and online shopping behaviors.
Table of Contents
Mobile Usage and Gen X
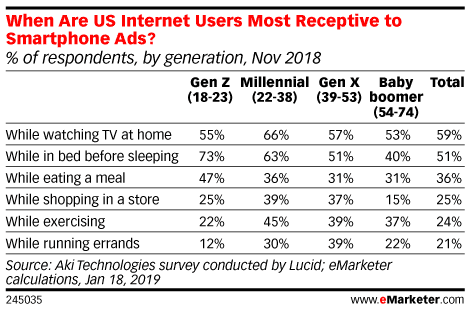
According to an Emarketer interview with MacPherson, vice president of digital product and strategy at Epsilon, Gen Xers are avid smartphone users, who frequently shop online. They are also influenced by digital ads, but their reception to such advertisements vary by activity. A 2018 survey by Aki Technologies found that Gen Xers aged 39 to 53 are most receptive to mobile ads while watching television (57 percent), relaxing in bed (51 percent), shopping in-store (37 percent), and running errands (39 percent).
US Mobile Internet Usage
Smartphone Internet users make up 93.4 percent of all Internet usage in the US, according to Emarketer. Out of 223 million mobile phone Internet users total, 219.8 million are smartphone users (up 6.1 percent from 2016). An estimated 157.4 million users are tablet Internet users (up 4.6 percent from 2016).
Mobile-only Internet users who own tablets, smartphones, and feature phones are up 11.1 percent from 2016, whereas desktop- and laptop-only Internet users are down 11.8 percent from 2016. While users may continue to use a combination of desktop or laptop and mobile to use the Internet, Emarketer expects desktop- and laptop-only Internet usage to continue to decline.
Mobile Ad Spend
US mobile ad spending totaled $58.38 billion in 2017, up 25 percent from 2016. An estimated $45.26 billion of that total went towards in-app ads. Additionally, ad spend invested in mobile was double the ad spend in desktop.
Mobile Ad Formats
Mobile display formats (video, rich media, and banner) make up 51.8 percent of mobile ad spend. Within that percentage, mobile video makes up 10.2 percent, mobile rich media makes up 16.7 percent, and mobile banner or other makes up 24.9 percent. In contrast, mobile search makes up 44 percent of mobile ad spend. Emarketer attributes the bigger investment in mobile display formats to the increasing consumer usage of social networking and mobile video consumption.
Mobile and Social
About 174.4 million users take part in social networking on their mobile phones (up 6.9 percent from 2016). One hundred fifty-seven users engage with Facebook on their mobile phones while 84.7 million and 79.2 million engage with Instagram and Snapchat on their mobile phones, respectively. Although the growth rate for mobile social networking has decreased to single-digit percentages, Emarketer says growth for mobile is still faster.
Mobile Time Spent and Activities
Primarily, Emarketer says users spend their mobile time in apps, making up 84 percent of total mobile Internet time. As for time spent in browsers on mobile devices, it’s frequent, but very brief, making up only 15 percent of total mobile Internet time.
Out of the total amount of time spent on mobile Internet, 34 percent is spent on tablets and 65.3 percent is spent on smartphones. Tablet browser usage makes up only 23 percent of tablet Internet time, with tablet app usage making up 77 percent of tablet Internet time. Smartphone browser usage makes up only 11 percent of smartphone Internet time, with smartphone app usage making up 89 percent of smartphone Internet time.
As for app usage overall, mobile social-network app usage makes up 23.9 percent of mobile app time; mobile game apps make up 14.3 percent; mobile video apps make up 18.7 percent, and other app activities make up 43.1 percent.
Mobile and Shopping
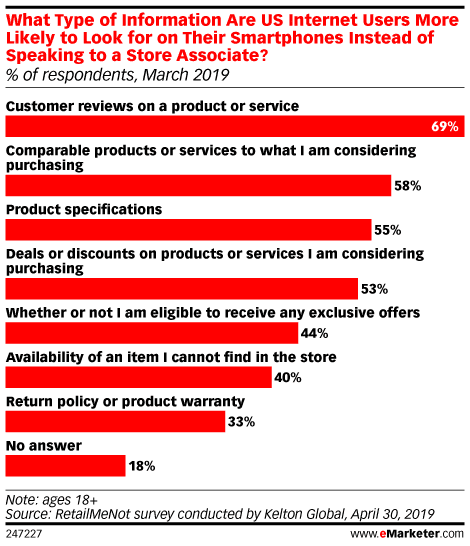
According to Facebook’s mobile insights, consumers are more likely to make in-store visits to businesses when store owners target their audience with personal yet professional ads, such as Click-to-Messenger and Store Visits Ads. Once at the physical store, consumers are also more likely to use their phones to ask their friends for advice about a purchase they are thinking of making. Similarly, if consumers want to learn more about a product, they often go straight to their phones to get information, rather than speak to store associates, a RetailMeNot study found.
Mobile and Consumer-Business Relations
In the same Facebook study, the social media company asserts that calling a business is no longer the most convenient way to obtain information about a product or service. In fact, consumers are now more comfortable communicating with businesses through instant messaging apps, such as Facebook Messenger. This method is more convenient for them.
When considering mobile strategies, it’s also important to create stunning app designs.